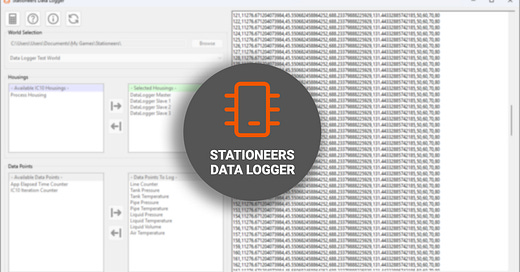
Stationeers Data Logger
A Windows app to log Stationeers data as csv files for later visualization.
At last! The Windows App absolutely no one asked for, and probably 5 people will find useful is here!
For real though… I actually built this for myself to use, It works and I’m happy with it. If you think you might like to use it, feel free to download it and give it a whirl.
I tested it, but there are going to be bugs and it should be considered a beta. It is also not filled with every feature and function it could have, but if you want to get data out of Stationeers… it will make your life a tiny bit easier.
What is this thing?
The Stationeers Data Logger works with in-game IC10 housings to extract Stack Variables automatically from your world.xml files. It will parse the xml data and convert it into any arrangement you wish, and save it all as a csv file which can be opened in any spreadsheet app and be used to make graphs and charts.
While there is a meager 512 Variable limit on each IC10, you can chain together as many housings as you want, to get as much data out as you need. The IC10 DataLogger Master and Slave code I have written (that is used in conjunction with the app) has a maximum record rate of 1 “Data Packet” per tick (0.5 seconds).
A Data Packet consists of an Iteration Counter + All The Variables You Want To Log.
The number of DataLogger Housings you will need depends on how many variables you want to log and how fast you want to log them.
In this example setup I am logging 8 variables from the “Process Housing” at a rate of 1 Data Packet per 0.5 seconds. To do this without losing data from the limited stack size, I require 4 DataLogger Housings (1 Master and 3 Slaves) with an AutoSave rate of 80 seconds. Alternatively, I could have also used 3 DataLogger Housings with an AutoSave rate of 60 seconds.
It can be fairly annoying to figure out the exact settings required (especially when testing) so I have also included a calculator in the App that will quickly figure this out for you.
Why is this a thing?
In a recent substack post I did for a compact oxygen collector build, I found myself wanting a way to see the efficiencies of the build as at ran to better choose the settings for the system.
I was not able to find anything like the Stationeers Data Logger so I had to devise a Rube Goldberg-esque series of steps to get the data I needed.
I setup the Oxygen collector system in Stationeers creative mode, and added the data I wanted to see to some large led displays, I ran the system… and faced the led displays and recorded a video at 1 frame per second using OBS. I opened the video in VLC Media player and setup a mouse/keyboard macro to take a screenshot and advance the video one frame. The macro then pasted the screenshot into Windows Photo App, and using its built in OCR feature, had the text of the led screens extracted. The macro then pasted that text, line by line into Notepad++ along with all the required commas and line endings to finally create the csv.
I went for lunch, and when I came back it was done! While I was happy to have the data, there were some issues. Firstly it took over an hour to complete the transfer, not so good. The OCR had some issues as well, it mistook 8’s for 0’s and 0’s for 8’s on quite a few frames and some it couldn’t recognize entirely… which meant even more time going in to fix the data by hand. The whole process was also giving me a “man takes pictures of funny memes on his desktop monitor with his phone, then emails them to himself so he can print them off on his desktop printer and take them down to the Rotary Club to show the boys” vibe, which I did not enjoy.
A few very helpful reddit comments by u/unrefrigeratedmeat later and here we are.
Where is this thing?
You can download the zipped installer from my github. This has been tested on Windows 11, but it should also run on Windows 10 [64Bit] without issue (please let me know if you try it).
The git also has detailed instructions on use and setup, including IC10 code.


